
Many business owners perceive web analytics as complex charts and endless tables understood only by programmers. In reality, it is the “pulse” of your business online. Imagine running a store blindfolded: you hear the sound of the cash register, but you don’t know how many people walked in, why they left without buying, or which product they looked at the longest. Analytics removes that blindfold.
Today, when every click costs money, ignoring the numbers is equivalent to throwing a portion of your profits into the trash. Let’s break down the five key metrics that will help you understand what is actually happening on your website.
1. Traffic Sources: Where is the Money Coming From?
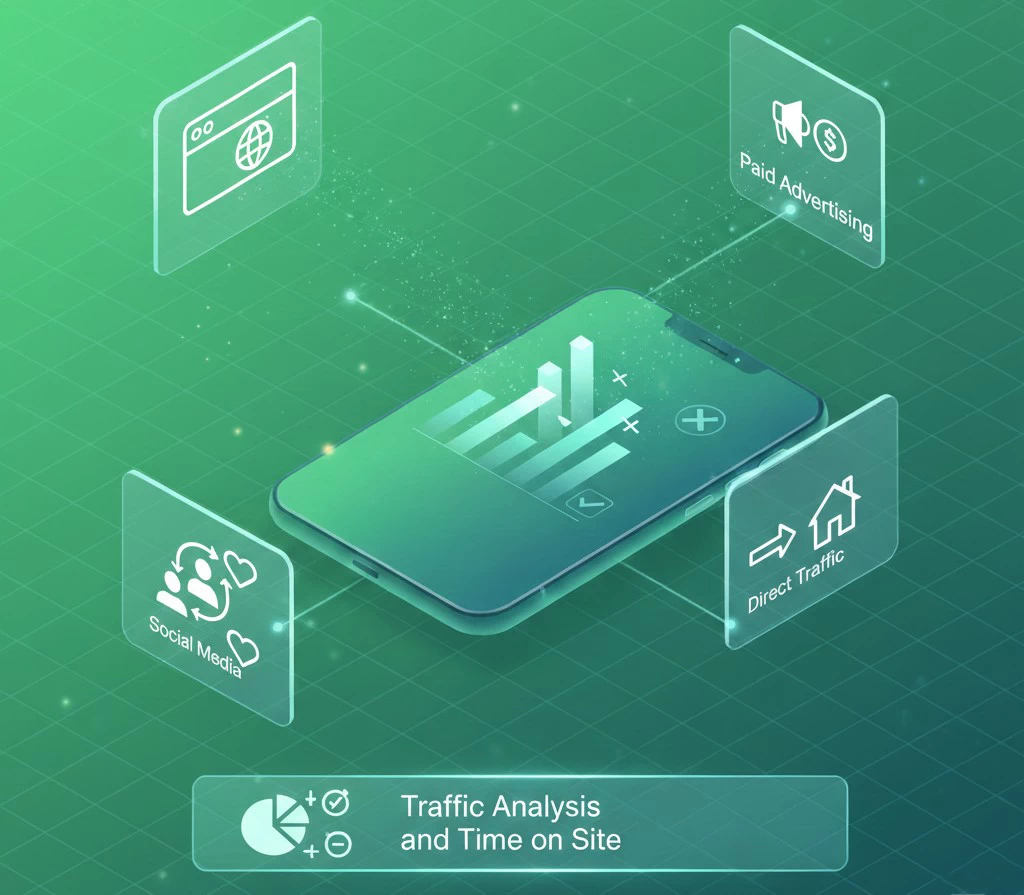
The first thing you must know is how people find you. This could be through Google search, paid ads, social media, or direct visits. Interesting fact: Statistics show that visitors from organic search typically spend 40% more time on a site than those arriving from short-form advertisements. Why does this matter? If you see that one channel brings in many people who don’t buy, while another brings fewer visitors but every second one becomes a customer—you know exactly where to invest your budget.
2. Bounce Rate: Why are They Leaving?
The bounce rate is the percentage of people who close your website almost immediately after opening it. If this figure exceeds 70-80%, it’s a red flag. Perhaps the site takes too long to load, or the user didn’t find what was promised in the ad. 2026 analytics show that the modern user will not wait more than three seconds. If they don’t see useful information within that time, they go to a competitor. Bounce rate is your primary indicator of your site’s technical health and usability.
3. Customer Journey: What are They Clicking?
It is important to understand not just the fact that someone visited, but what they are doing there. Which buttons do they press? Which pages do they read before purchasing? Entrepreneurs often assume the homepage is the most important. However, analysis might show that most people land directly on a blog post or a specific product page. Understanding the “customer route” allows you to remove unnecessary obstacles on the path to the “Buy” button.
4. Conversion Rate: The Ultimate Success Metric
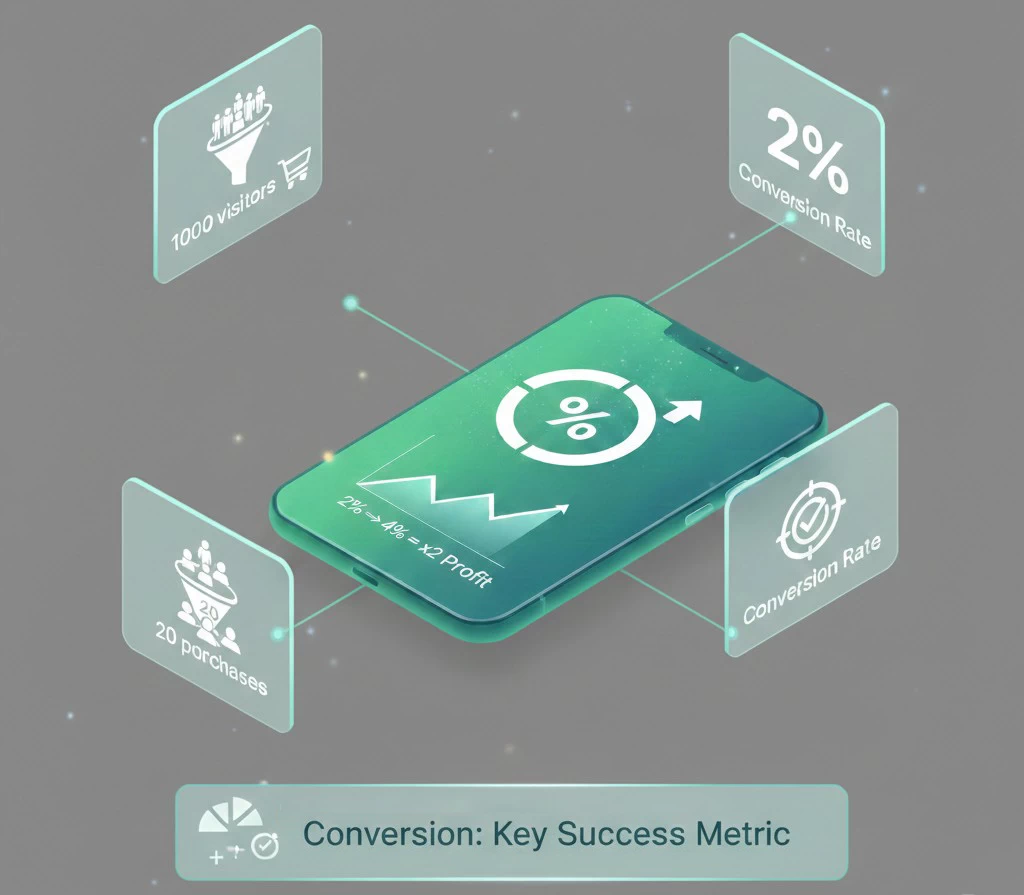
This is the heart of your analytics. A conversion is the percentage of visitors who completed a target action (called, submitted a lead form, made a purchase). For example, if 1,000 people visited the site and 20 made a purchase, your conversion rate is 2%. A true expert knows: you don’t always need more visitors. Sometimes it’s easier to increase the conversion rate from 2% to 4% than to try to attract twice as many people. This doubles your profit without increasing your advertising spend.
5. Customer Acquisition Cost
You must know exactly how much one buyer costs you. If you spent 1,000 UAH on advertising and gained 10 customers, then one customer cost you 100 UAH. If your net profit per order is less than this amount, you are operating at a loss. Web analytics allows you to see this math in real-time and stop ineffective spending before it’s too late.
Web analytics is not about numbers; it’s about decisions. It answers the questions: “Do people like my product?” and “Am I spending my money wisely?”. Start with at least one basic tool (like Google Analytics), and you will see your business through entirely different eyes.




Comments