
Reports and dashboards (Data Studio/Looker Studio)

Reports and Dashboards (Looker Studio) — visualize the hidden data of your business, stop managing by touch, and get a single marketing control center.

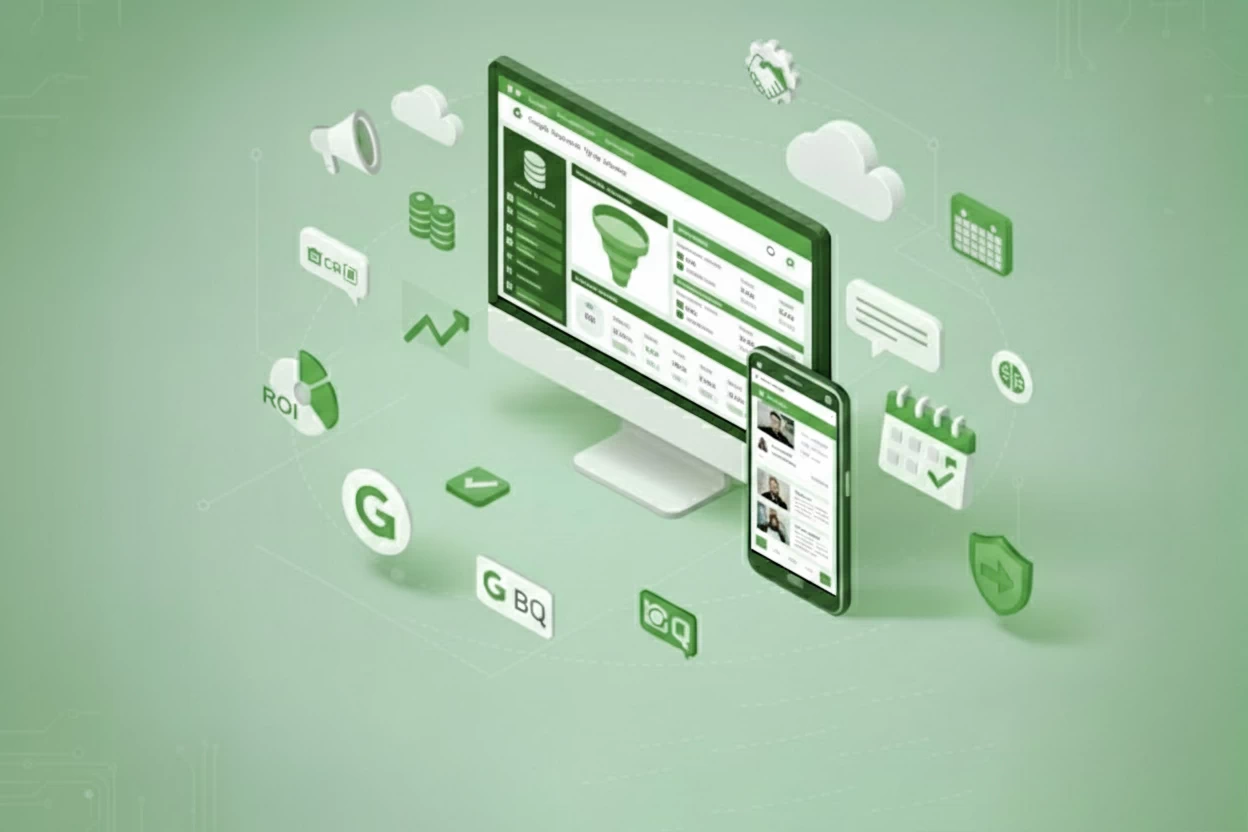
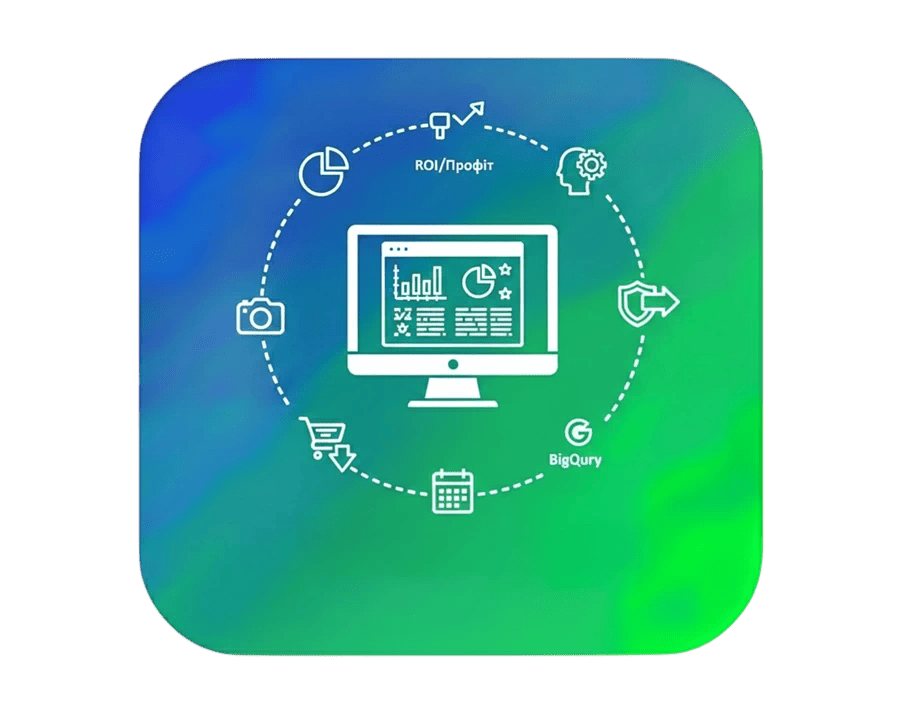
Professional creation of interactive dashboards in Looker Studio (formerly Google Data Studio) is a fundamental transformation of chaotic figures into a clear visual strategy that allows you to instantly understand the effectiveness of your marketing and sales. I perform a full integration of all your data sources (GA4, Google Ads, CRM, social networks), creating an automated reporting system that updates in real-time. My goal is to provide you not just with a set of charts, but with a convenient instrument panel where every figure helps make informed decisions for business scaling and profit maximization.

  • My clients receive individual analytical dashboards, the implementation of which allows for reducing report preparation time by 95% and focusing on real growth.

  • Over the past 3 years, I have implemented over 150 complex data visualization projects: from automating reporting for marketing agencies to custom BI solutions for large eCommerce.

  • Thanks to the unification of data from different channels in a single window, my reports help businesses find anomalies and growth points that were previously lost in scattered tables.

Are you spending hours consolidating data manually or do you not understand the real cost of customer acquisition — are you ready to change this?

Order professional dashboard development and get a transparent control system for every cent of your budget.

Key Benefits of Automated Reports in Looker Studio

Single source of truth:

combining data from Google Ads, Facebook, Instagram, LinkedIn, and your CRM into one report.

24/7 Automation:

data updates automatically — you no longer need to wait for the end of the month to see the result.

KPI Visualization:

clear display of key indicators (ROI, ROMI, CPA, LTV) in the form of visual diagrams and charts.

Flexible filtering:

the ability to instantly view data for any period, in the context of specific campaigns, devices, or regions.

Team time savings:

instead of manually copying figures into Excel, your employees engage in optimization and strategy.

Transparency for investors:

presentable and clear reports that can be shared via a direct link at any moment.

Rapid reaction to changes:

you instantly see a drop in conversion or a rise in cost-per-click, allowing you to save the budget even before the end of the day.

How I Create Dashboards in Looker Studio (Step-by-Step Comprehensive Process)

Source Audit and Data Architecture Design: Analytical Foundation

I begin with a deep analysis of how your business collects data. My task at this stage is to check the cleanliness of the incoming information and build logical connections between different platforms to avoid errors in the final calculations.

  • Source inventory: Checking the correct operation of Google Analytics 4, Facebook Pixel, CRM settings, and advertising accounts.

  • KPI Definition: Joint selection of metrics that actually impact your profit. We don’t draw charts for the sake of charts — we visualize management levers.

  • Building Connection Architecture: Using native connectors or third-party services (Supermetrics, Windsor.ai) for uninterrupted data transmission.

  • Example: Combining expenditure data from Facebook Ads and revenue from your CRM allows you to see the payback of every ad in real-time, which usually increases remarketing effectiveness by 40% in the first month.

Order Looker Studio Dashboard Development

Reports and dashboards (Data Studio/Looker Studio)

An automated dashboard is the most rational investment in the management part of your business. It allows you not to guess the reasons for success or failure but to act based on hard data. This service is essential if your marketing becomes multi-channel, if you are planning to scale, or if you want to check the quality of work of your current contractor. Thanks to a systemic approach, you gain full control over the digital environment of your resource and a clear understanding of how to outpace competitors and increase your capital.

from 2000 UAH
Order
Frequently Asked Questions

Here you can find answers to frequently asked questions.

Standard Google Analytics 4 or Facebook Ads Manager reports are created for narrow specialists and are often overloaded with technical information that does not provide a direct answer to business questions.

  • Data fragmentation: Google won’t show you expenses from Facebook, and a CRM doesn’t know which ad the client came from. Only in Looker Studio do they meet in one table.

  • Interface complexity: Spending 20 minutes searching for the right report in GA4 is inefficient. In a dashboard, everything is brought to one screen.

  • Impossibility of custom calculations: Standard systems do not know how to calculate your real margin or ROI considering taxes and discounts.

  • My approach: I create a “translator” from the language of advertising platforms to the language of money. You get a business tool, not a technical report.

Contact for business

Do you have any questions? Write to me

Briefly describe your request - I will analyze the situation and propose a cooperation format within 24 hours.

  • Parsing your request without water
  • Focus on results and profit
  • I work with businesses of any size

Fill out the form and choose the messenger in which you are best contacted.